Digital Analytics
I built this website to showcase my digital analytics skills and to practice what I've learned. I've set up Google Tag Manager to track user interactions and connected it with Google Analytics 4 for data collection. I also created a report in Looker Studio to visualize data and see site performance. This project has helped me sharpen my skills and show how I can set up and use analytics tools effectively.
Implementation
- Google Analytics 4 implementation
- Tag Implementation and Management
- Variable Management
- Data Layer Setup
- Google Analytics (GA4) Ecommerce Tracking
Navigation tracking
The navigation links trigger a data layer push with the event "navigation_click," sending this information to the data layer. I'm using Google Tag Manager to track these navigation clicks, dynamically capturing which specific link is clicked through a custom JavaScript variable.
GA4 Ecommerce tracking
Each button bellow is generating a data layer push according to the GA4 ecommerce schema.
Visualization
Description of Project 1.
Google Analytics Report
Data Analysis
I invite you to explore my data analysis projects on Kaggle, where I showcase my skills in data manipulation, visualization, and interpretation. Each project reflects my passion for uncovering insights from data and my commitment to continuous learning. Kaggle Code
Transactional Data Analysis
Transactional data analysis refers to the process of examining and interpreting data generated from transactions within a business or organization. This type of analysis focuses on the details of individual transactions, which can include sales, purchases, payments, and other interactions that involve the exchange of goods or services.
Working with Transactional Analysis in E-commerce
Forecasting example
Forecasting is a crucial aspect of business analysis, as it enables analysts to gain deeper insights into various functions within the organization. By predicting future outcomes based on actual customer behavior, analysts can provide valuable information that impacts multiple departments
- How many new and returning customers does your company have, and how does their spending behavior compare?
- How often do your customers make purchases?
- How does it vary over time?
Forecast
Here is the Google Sheet with my data analysis:
Cohort Analysis
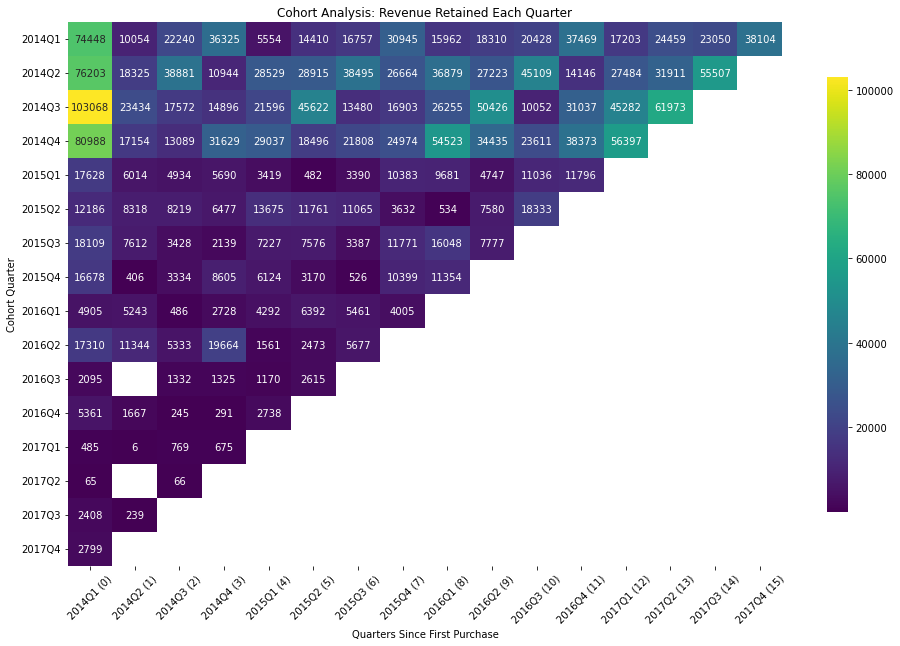
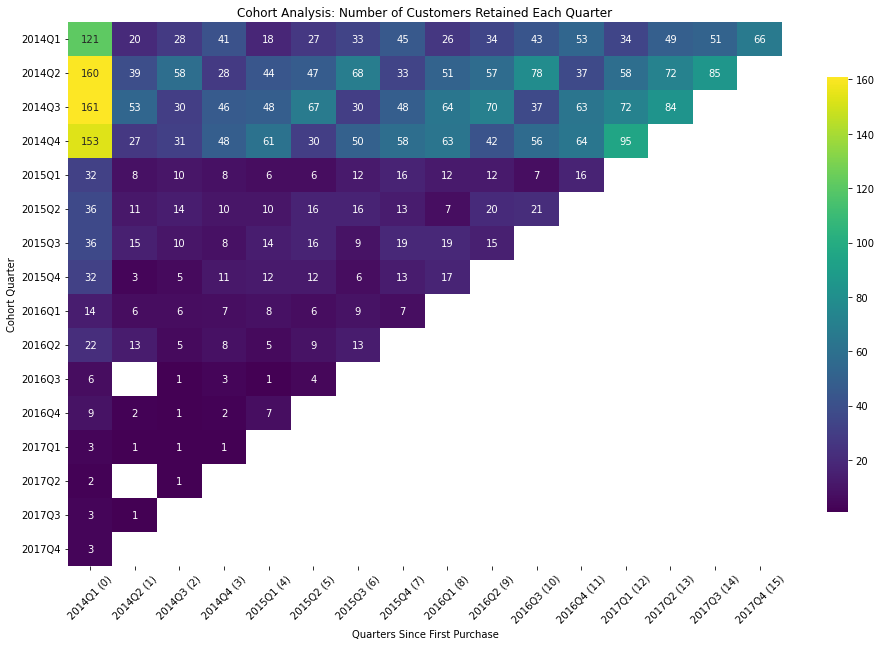
Cohort Analysis is a form of behavioral analytics that involves grouping similar subsets and tracking their performance over time. In the context of e-commerce, it assesses groups of customers and the value they contribute to your business throughout their entire relationship with your brand. Typically, customer cohorts are organized based on their acquisition period, often on a monthly basis.
- Revenue Cohorts: As the name implies, Revenue Cohorts metrics track customer spending patterns and the monetary value they generate for your business over time.
- Retention Cohorts: Retention Cohorts metrics provide insights into how frequently your acquisition groups return to make purchases over time. This analysis focuses on understanding when customers come back and the frequency of their purchases. Retention metrics are crucial for e-commerce growth, as companies typically aim for each customer to make at least two purchases.


Marketing Channels
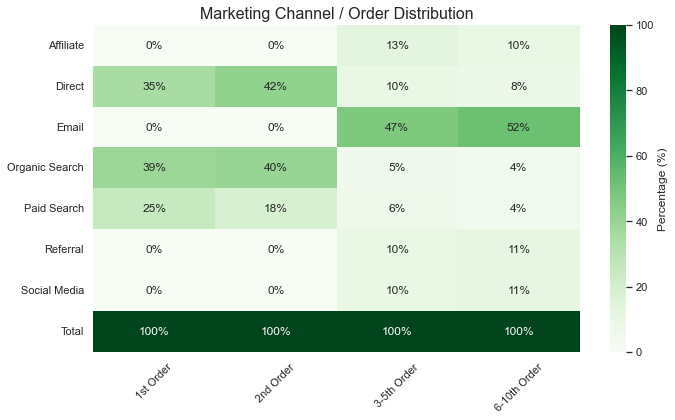
Tracking the marketing channels attributed to each sale is essential for understanding the purchasing cycle and optimizing marketing strategies.
- Attribution of Success: By identifying which marketing channels effectively drive sales, businesses can allocate resources more efficiently. This allows for a clearer understanding of which campaigns are generating the highest return on investment (ROI) and should be prioritized.
- Understanding Customer Journeys: By analyzing which marketing channels lead to repeat purchases, businesses can gain insights into the customer journey. This understanding allows for the identification of key touchpoints that encourage customers to return, enabling more effective engagement strategies.
- Maximizing Customer Lifetime Value (CLV): By tracking the impact of various channels on repeat purchases, businesses can work to maximize CLV. Understanding which channels lead to additional purchases helps create targeted campaigns that nurture long-term relationships with customers.

Time Between Purchases
The gap between a first purchase and a second purchase is one of the biggest challenges in e-commerce and retail – possibly the most significant hurdle in the entire customer journey. By tracking the Time Between Purchases, you can identify customers who are most likely to make another purchase within a specific timeframe and target them with tailored offers and incentives. The key is timing: it’s better to act when the interest is high, rather than risk overwhelming customers with too many incentives and potentially causing annoyance.
